Model Map Fact Sheet
Oak Ridges Moraine Groundwater Program
09/12/2021
Introduction
The Oak Ridges Moraine Groundwater Program (ORMGP) has been supporting partner agencies with their numerical modelling studies for many years. Because of the large number of models that have been developed within the ORMGP area, many models exist, from local-scale water budgets to regional-scale, three-dimensional groundwater flow models. The Model Mapping Tool (under development) is a new feature on the ORMGP mapping website. This tool allows users to identify all documented numerical models that are associated with a selected watershed or municipal boundary.
Model Mapping Tool
While the model-mapping tool is under development, it can be accessed on the Partners’ website by opening the Consolidated Mapping feature. From there, click the “I want to…” button, as seen below: 
Figure 1: Getting Started with the Model Mapping Tool
The ORMGP website can display the model boundaries for all documented modelling studies in the ORM area. To support partner agencies, website users now have the ability to select a municipal or watershed boundary and see all models that are affiliated with that boundary.

Figure 2: Durham Region and associated models
These areas might reflect important groundwater dependent habitat areas where cold groundwater discharges to the stream network. For instance, a review of cold-water fisheries mapping suggests a coincidence of observed cold water streams and the mapped PDAs.
Level 1 (WT1)
Level 0 Plus Added Corrections
Closer examination of the WT0 suggested that there might be ways that the map could be improved using expert knowledge and additional data sources. With the corrections incorporated, the map is named Water Table Level 1 (WT1). Corrections made to WT0 include:
Incorporation of Streams
Given the interconnectedness of the groundwater and surface water systems across the ORMGP area, as evidenced by the prevalence of perennial streams, it is postulated that, as groundwater discharges to streams, the streams reflect the elevation of the water table. By distributing “stream nodes” at an approximate 500 m spacing along mapped watercourses, elevations are collected as surrogate water table points allowing for the interpolated water table to be constrained in river valleys.
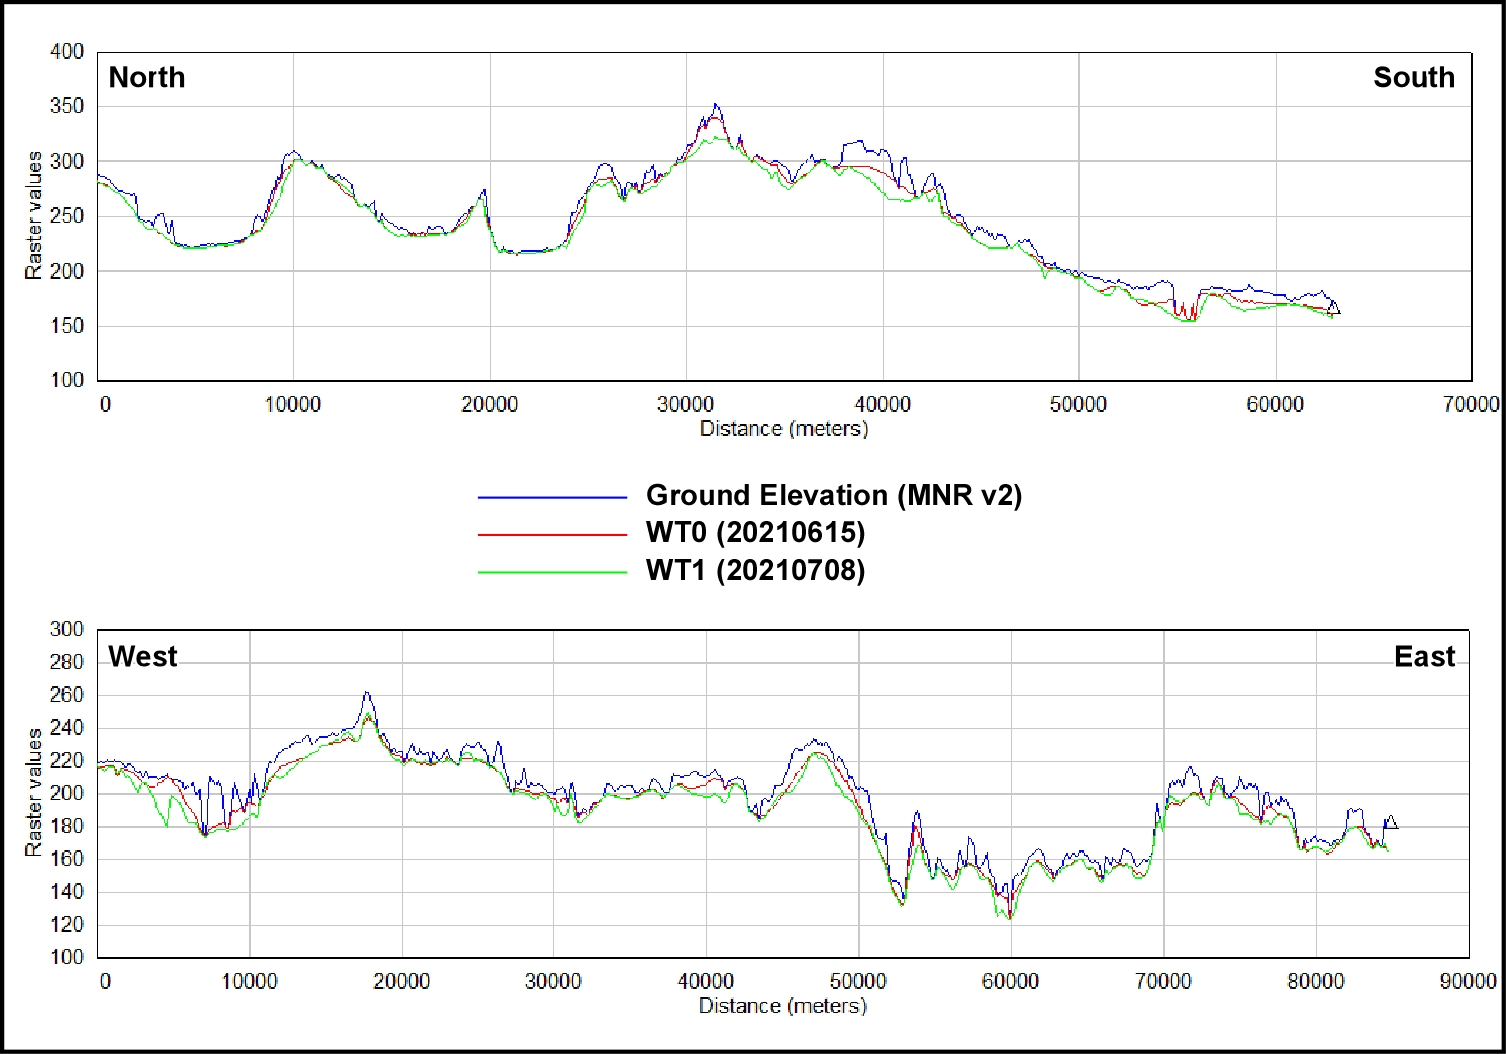
(https://raw.githubusercontent.com/OWRC/watertable/main/fig/f9.jpg)\ Figure 9: General West-East and North-South cross-sections showing variation of the WT0 and WT1 surfaces in comparison with the ground surface.
\)
Any interpolated water table surface is an approximation. Field data collected through drilling and groundwater